The basic Chronoscope initialization and termination functions look like this:
The Chronoscope viewer window (note that recent builds may look a little different):
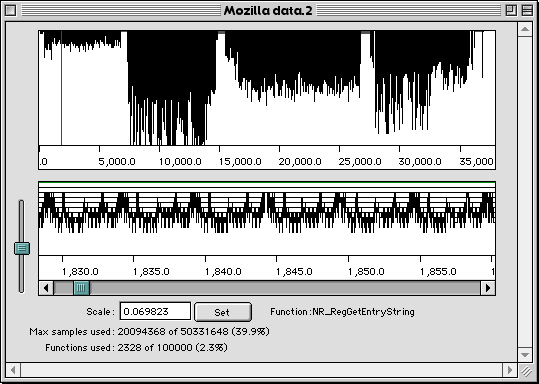
This window has two main panes, the Preview and Detail panes, and some controls at the bottom. The main features of this window are shown here:
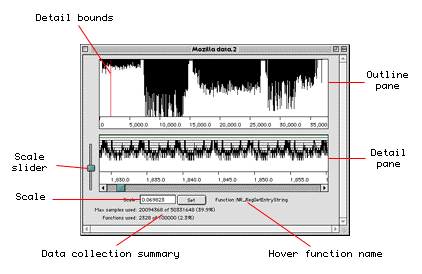
The preview pane gives an overview of the entire profiled session, scaling the
time between calls to ChronoInit() and ChronoTerm()
to fit inside the display area (so this view has to be redraw if you resize the
window). Like the detail pane, the preview pane is drawn incrementally to
maintain viewer responsiveness while the large amounts of data are processed.

Along the bottom of the preview pane is a scale, showing time in milliseconds.
The black bars dropping down from the top give a summary of stack depth over time, which reflects the number of nested function calls. This is intended to provide a 'map' which allows you to identify major program blocks, and locate interesting parts of the code. Note that, for most traces, there will be many more samples than can be displayed in this view; the preview pane is drawn by taking the closest sample to the start time of each horizontal pixel in the view, and will therefore not show all the details of program execution.
The red box in the preview pane show the time period that is being examined in the detail pane (see below); as you scroll around and change scale in the detail pane, this red box is updated. Similarly, dragging the red box here to the left and right changes the time period displayed in the detail pane.
You'll also see some time periods in this pane that are filled with gray, and
during which the stack depth remains constant. This is time that is spent
within ChronoTask(), during which Chronoscope is writing sample
data to disk.
The detail pane gives you a more precise view of program execution over time.

Again, there is a milliseconds scale along the bottom. Every function entry and exit is shown in this pane, with each function on the stack adding a level of depth that is shown by the horizontal lines:
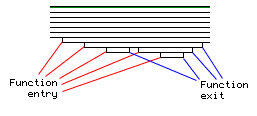
You can find out what a fuction is by mousing over it; the function name is shown below the detail pane. If you click on a function call it becomes selected, and some data on that call is shown.

Zooming into this view can give you information in unprecedented detail about the execution of your program over a period of a few milliseconds, or microseconds. You can see what functions call what other functions, how often they call them, and how long those calls take.
To adjust the view in the detail pane, you can navigate in four ways.
You can adjust the height for each function call using the little arrows to the right of the scale field, and adjust the height of the preview and timeline panes using the divider between them.
The timeline view can also be printed, but be warned: this can generate huge print jobs. ChronoViwer will attempt to print at high resolution if your printer supports it.
With code that has been properly intstrumented, the detail pane also shows thread context switches as a red vertical line in the trace:
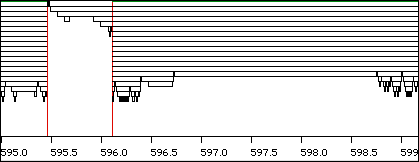
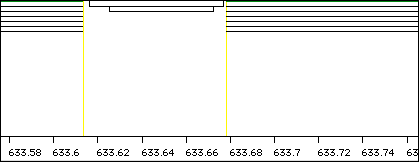
Interrupt code also shows up, this time indicated by yellow lines. This trace shows an asynchronous file I/O callback firing:
You can use the 'Collect statistics' window to collect statistics for the visible area of the detail pane. These statistics include, for each thread, what routines were called in that time period on each thread, and the amount of time spent in those functions and their descendents:
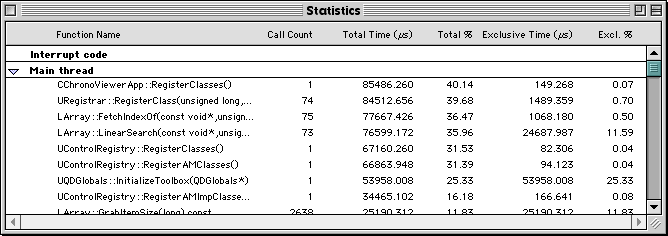
These data can be sorted by clicking on the column labels.
The Investigator window allows you to examine the profile data in more detail. It shows how long a function takes when called from other functions, and what proportion of time is taken in the various child functions of a given function.
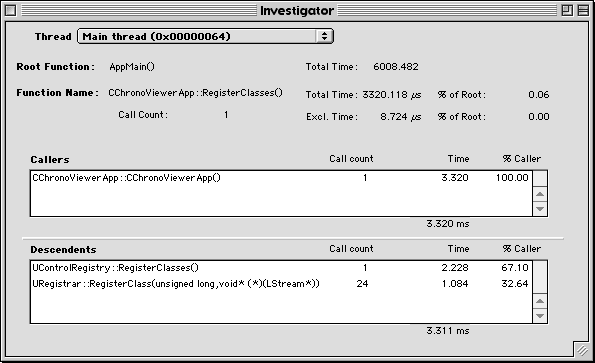
You can double-click on a function in either the Callers table, or the Descendents table, to make that function the current "focus", and see data on its callers and descendents. Callers and descendents may be sorted by clicking on the column headers.
By default, the Investigator window shows you data for the entire profiled run. You can narrow in on a specific section of code by specifying a "root" for the investigator. To do this, find the function call that is the root call for the code that you are interested in in the timeline view. Click on it to select it. Now choose 'Set as Investigator Root Function' from the Profile menu. The Investigator will now only show you data for functions called under that root.